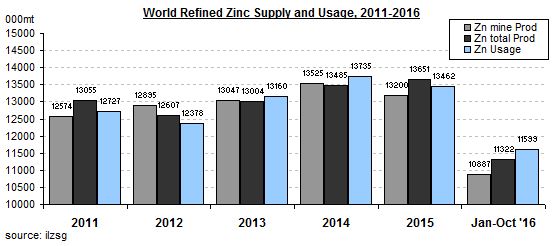
01 / 03 / 17 Chart of the day is… …zinc supply and demand, 2011 to 2016: NB: Please note cut down Y-axis Source here.