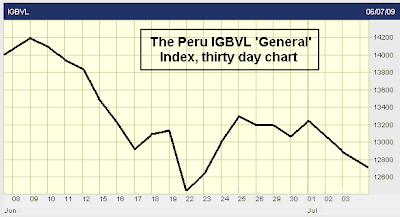
The 30 chart chart for the Lima IGBVL index and the 30 day chart for spot copper.
 Go on, tell me you think it’s a coincidence. Go on…….dare you….go on…..
UPDATE: Check out Monty High’s blog for a look on the latest developments in LME copper inventories and his call on the short term future of the metal.