The person who put this site together receives all my respect, it’s how you are supposed to do these charts and he has done many. Log scale, tracking countries against benchmarks (Italy and straight-line daily increases of differing %). Here is “warm countries” for example, which shows us that ambient temperature is less of a factor than was previously suggested:
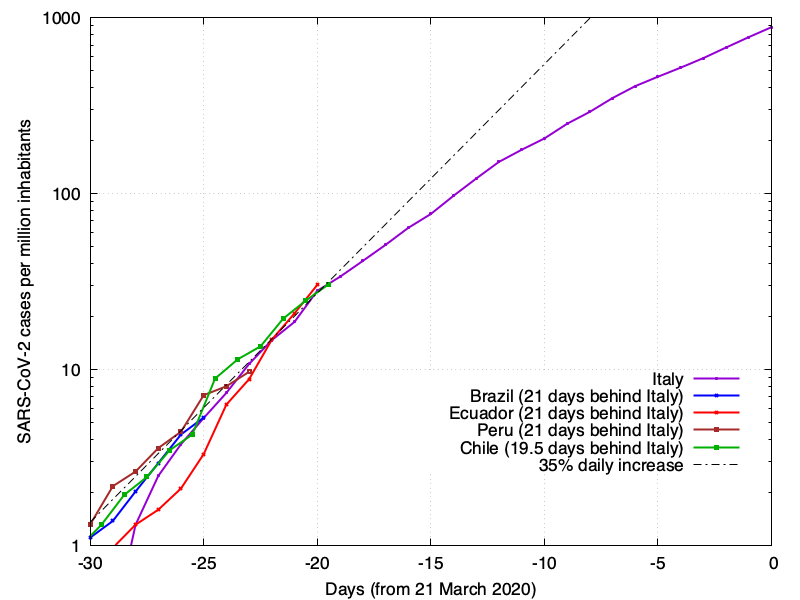
Of this sample, Peru looks likeliest to flatten the curve. I fear most for Brazil, frankly. Size matters.